Business Dashboard · 2026
Zippity Split — Technician Performance Dashboard
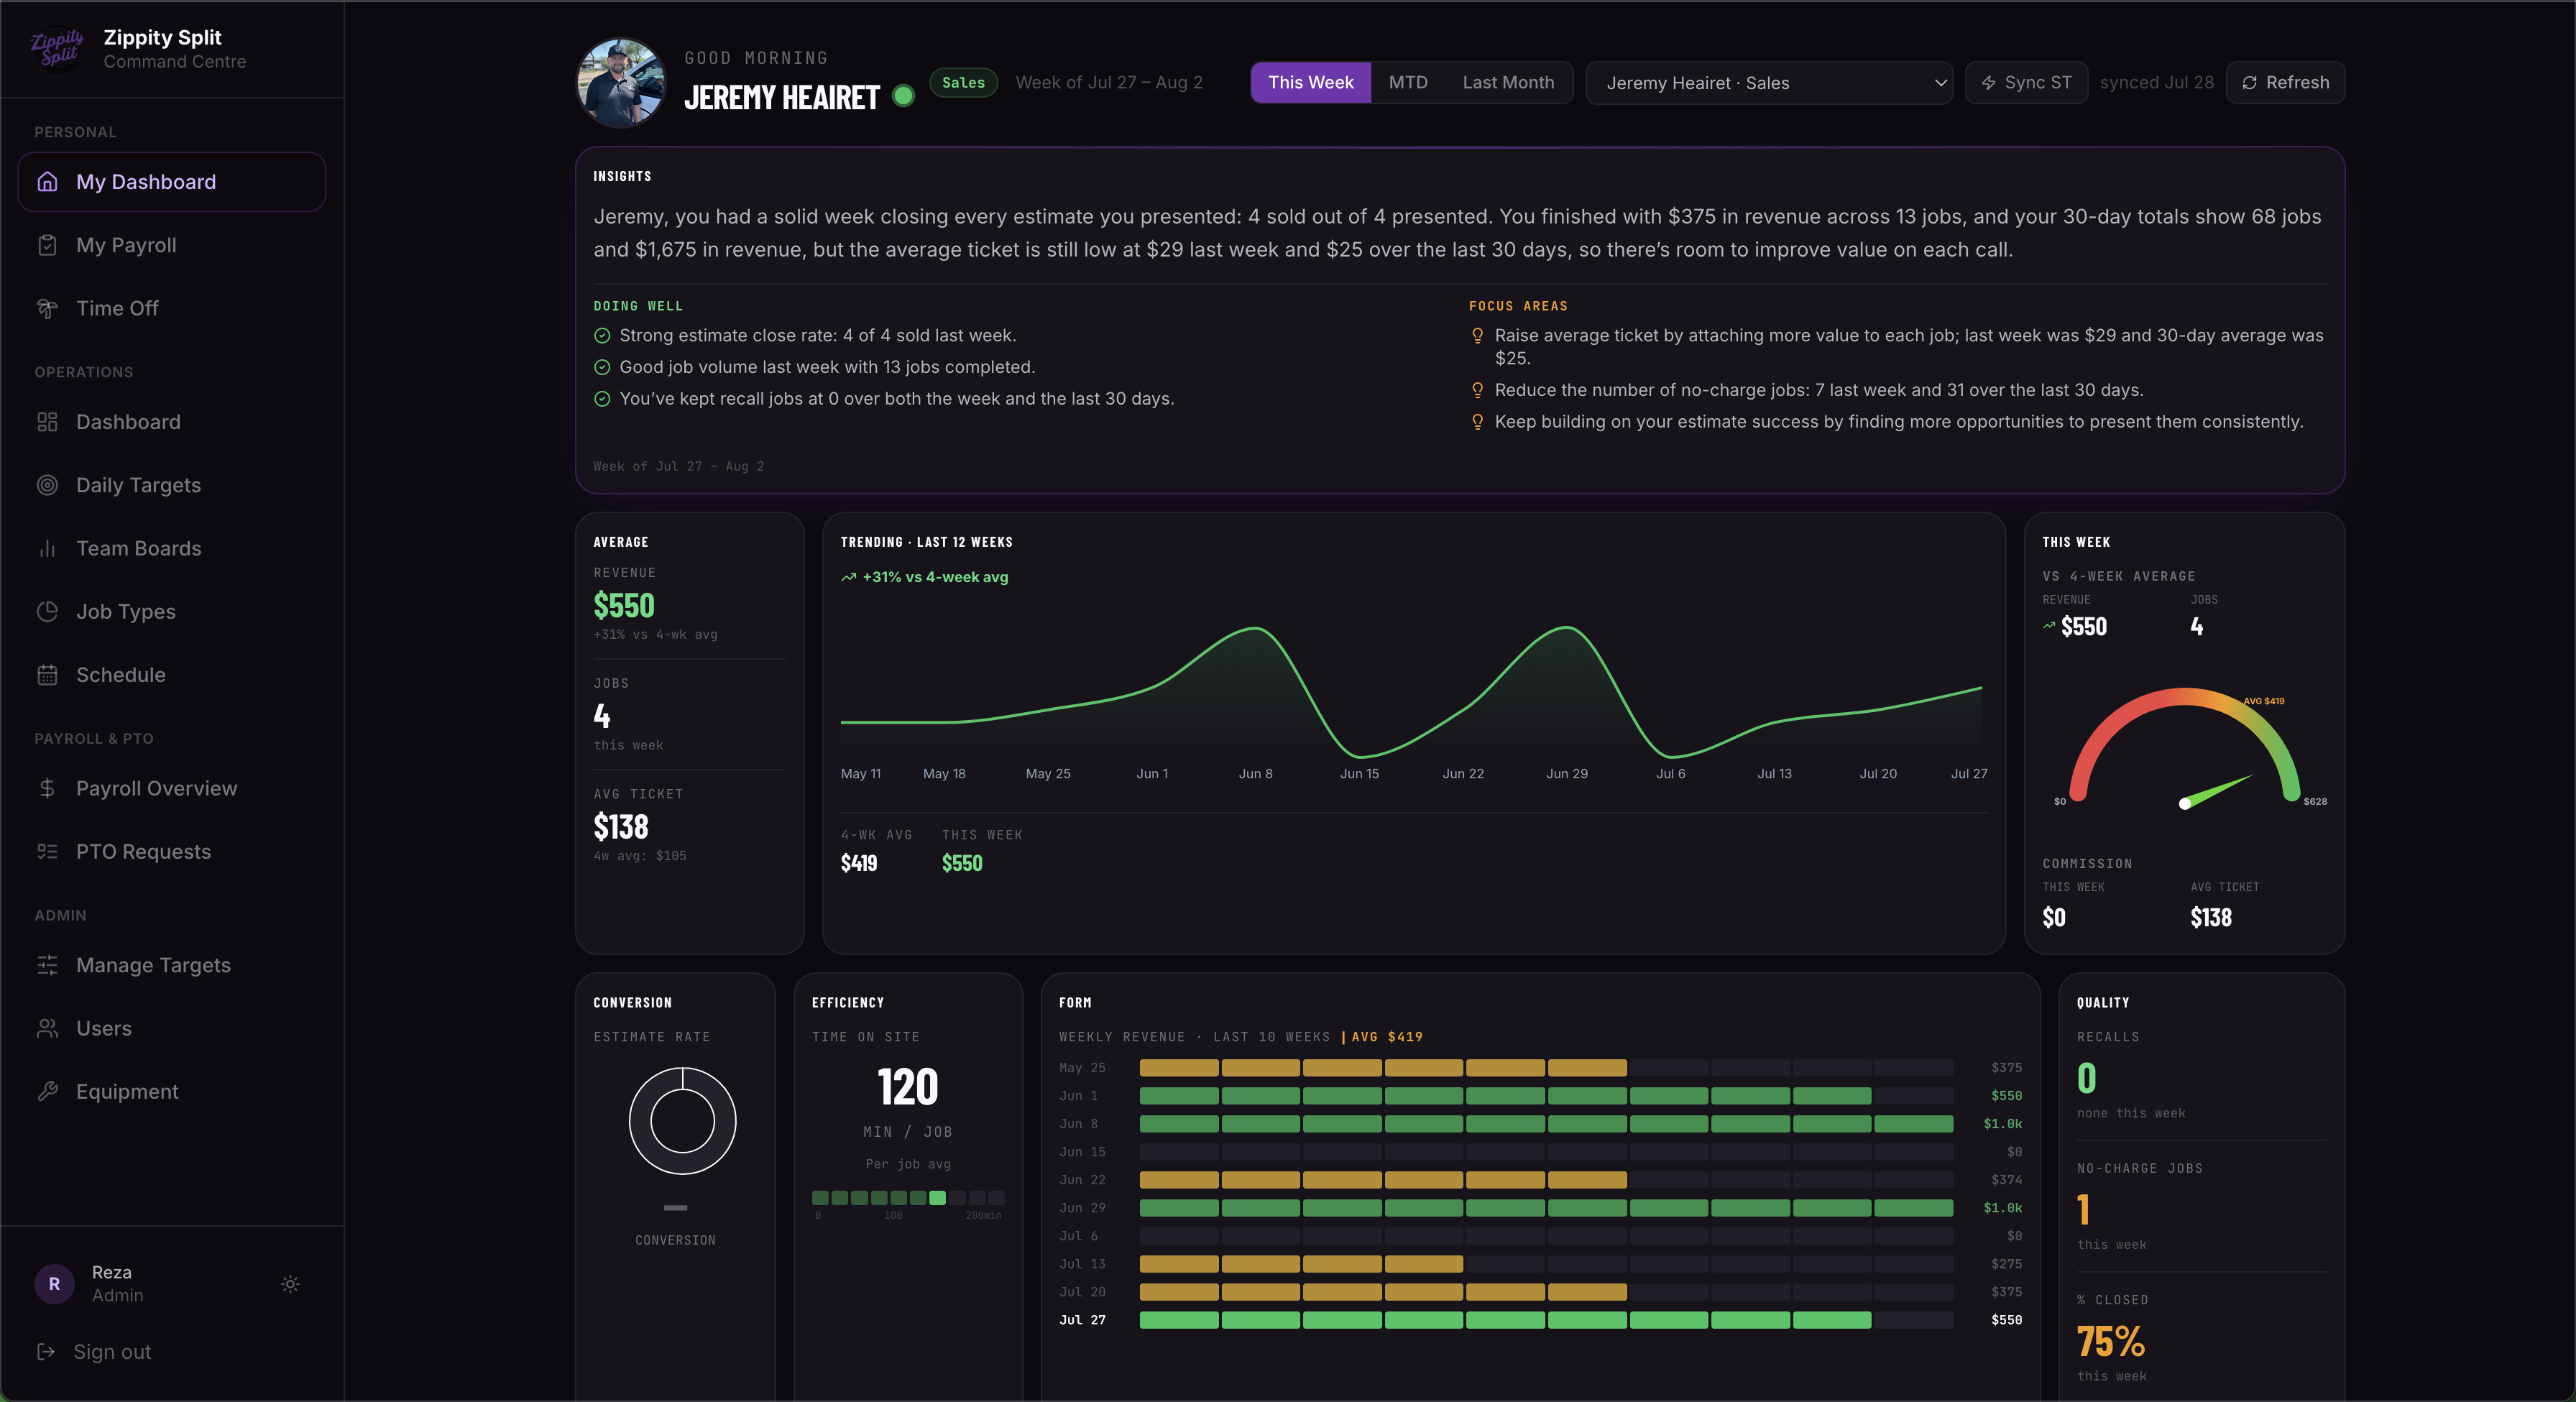
This plumbing company runs its field operations on ServiceTitan but had no live view of technician performance and no digital payroll process — every technician filled out their own commission sheet in Excel and emailed it in each week. I built "Zippity Split," a real-time performance dashboard synced directly from ServiceTitan, plus an in-app payroll approval workflow that replaced the Excel process outright.
Replaced an all-Excel payroll process, saving 30–40+ hours a month
Role
Full Stack Developer — building and iterating on the platform directly with the client.
Outcomes
~30–40 hrs/month
Manual payroll admin saved
Excel sheets → in-app approval
Payroll workflow
Jobs, timesheets, technicians
Data synced from ServiceTitan
The Problem
Technicians tracked their own completed jobs and commission rates in individual Excel sheets and emailed them to the office every week — a process prone to disputes, missing entries, and manual reconciliation on the admin side. Meanwhile, management had no real-time visibility into revenue, goals, or technician performance without pulling reports out of ServiceTitan by hand, so weekly team stand-ups ran on stale, manually compiled numbers.
What Was Built
- TV "Brag Board" dashboard showing a live technician leaderboard, revenue-by-business-unit, goal tracking, and sales pipeline
- Scheduled sync jobs pulling jobs, timesheets, and technician data from the ServiceTitan API into Postgres
- Technician-facing payroll approval workflow — each tech approves completed jobs with a commission rate and logs manual time (PTO, training) from their own dashboard
- Automated weekly consolidated commission report for the owner, replacing individually emailed spreadsheets
- Slack bot integration for real-time team notifications
- Per-technician Google Reviews tracking
Solution
I built the dashboard on Next.js and Prisma/Postgres, with scheduled cron jobs pulling jobs, appointments, timesheets, and technician records from the ServiceTitan API so every number on the TV board and admin dashboard reflects what's actually happening in the field, not a manually updated report. For payroll, I replaced the Excel-and-email process with an in-app workflow: technicians log into their own dashboard, review their completed jobs for the week, confirm the commission rate, and add any non-job time separately. At the end of the week, the owner gets a single consolidated report instead of a stack of individual spreadsheets — and because every figure traces back to a ServiceTitan job record, disputes over "what was actually completed" mostly disappeared.
Tech Used
Have a similar problem?
I help startups and product teams build fast, scalable web applications and move manual operations into software. Let's talk about what you're working on.